ツール解説
Model Context Protocol (MCP): a deep dive into the "USB-C port for AI" — architecture, primitives, and Sales Claw integration
18 分
Chrome DevTools MCP is the Chrome team's official MCP server for AI coding agents. v0.26.0 (2026-05-12) brings 42 tools across 10 categories, including Lighthouse audits and Core Web Vitals capture. This guide walks through setup and operational risk based strictly on first-party sources.

中澤 圭志
@keishi_nakazawaSales Claw maintainer
Key Facts
Release
v0.26.0 (2026-05-12) / public preview 2025-09-23
Vendor
Google Chrome / DevTools Team (Apache-2.0)
Capabilities
10 categories, 42 tools (Lighthouse / Performance / Network / DOM, etc.)
Clients
Claude Code / Codex / Cursor / Gemini CLI / Cline / VS Code Copilot — 10+ clients
"Claude Code and Cursor are smart, but they can't see inside the browser— so CSS regressions, JS errors, and Lighthouse score drops still need a human at the DevTools panel." That long-standing gripe got a design-level answer on 2025-09-23, when the Google Chrome team shipped Chrome DevTools MCP (chrome-devtools-mcp).
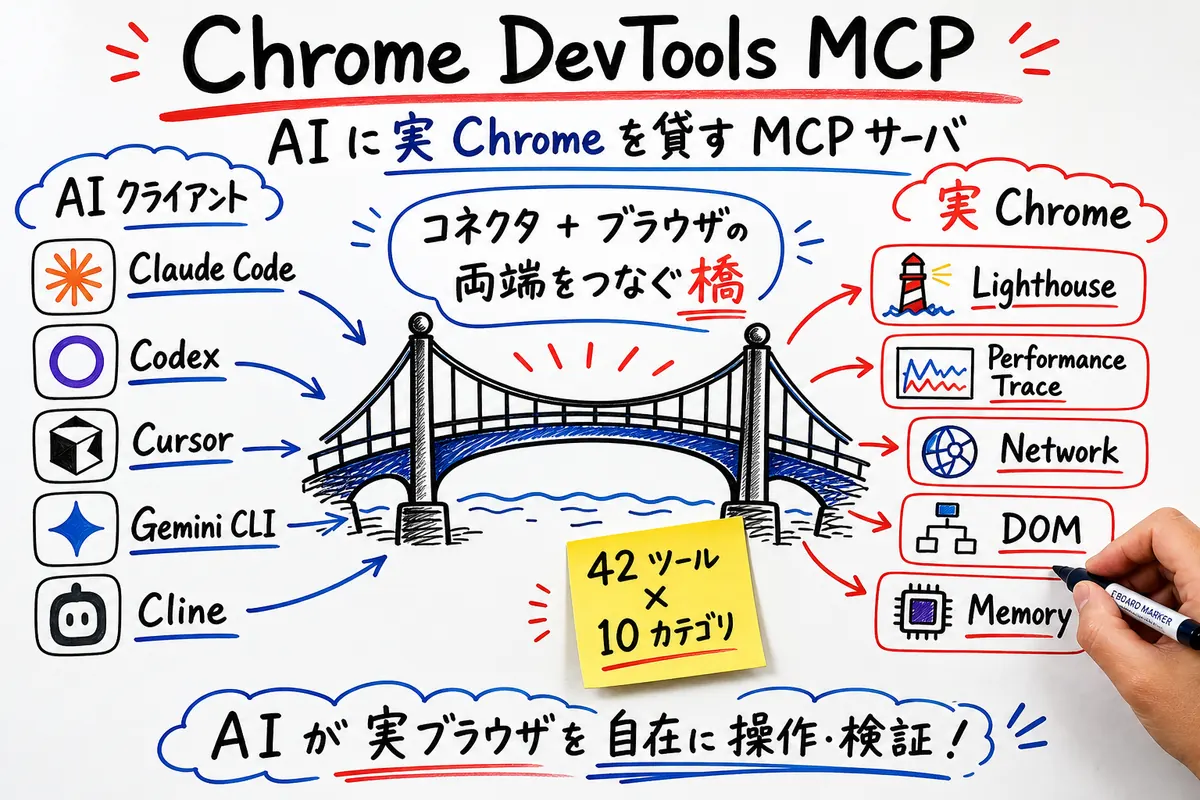
Chrome DevTools MCP is an official MCP server that conforms to the Model Context Protocol (MCP). It lets major AI coding agents — Claude Code, Codex, Cursor, Gemini CLI, Cline — drive a real, locally running Chrome instance. As of v0.26.0 (released 2026-05-12), it exposes 42 tools across 10 categories: Lighthouse audits, Core Web Vitals measurement, network monitoring, memory snapshots, and Chrome extension debugging are all first-class "fingertips" for the agent.

Primary sources for this article are the ChromeDevTools/chrome-devtools-mcp GitHub repo, the npm package, the Chrome for Developers Blog, and the CHANGELOG for each release tag. Version numbers, release dates, tool counts, and client names all follow the official spellings.
Until now AI coding had a fundamental gap. The LLM could read and write code, but it could not see what was happening inside the browser. Whether CSS was broken, whether Largest Contentful Paint had regressed, whether a request was returning 404 — those were tasks a human did with DevTools open.
Chrome DevTools MCP collapses that boundary into a clean four-layer pipeline: "AI agent ↔ MCP server ↔ Puppeteer ↔ real Chrome." From the AI's perspective, Chrome is just another MCP server alongside an image generator or filesystem server. When Claude Code or Cursor calls a tool like take_screenshot or lighthouse_audit, a real Chrome boots and runs in the background.
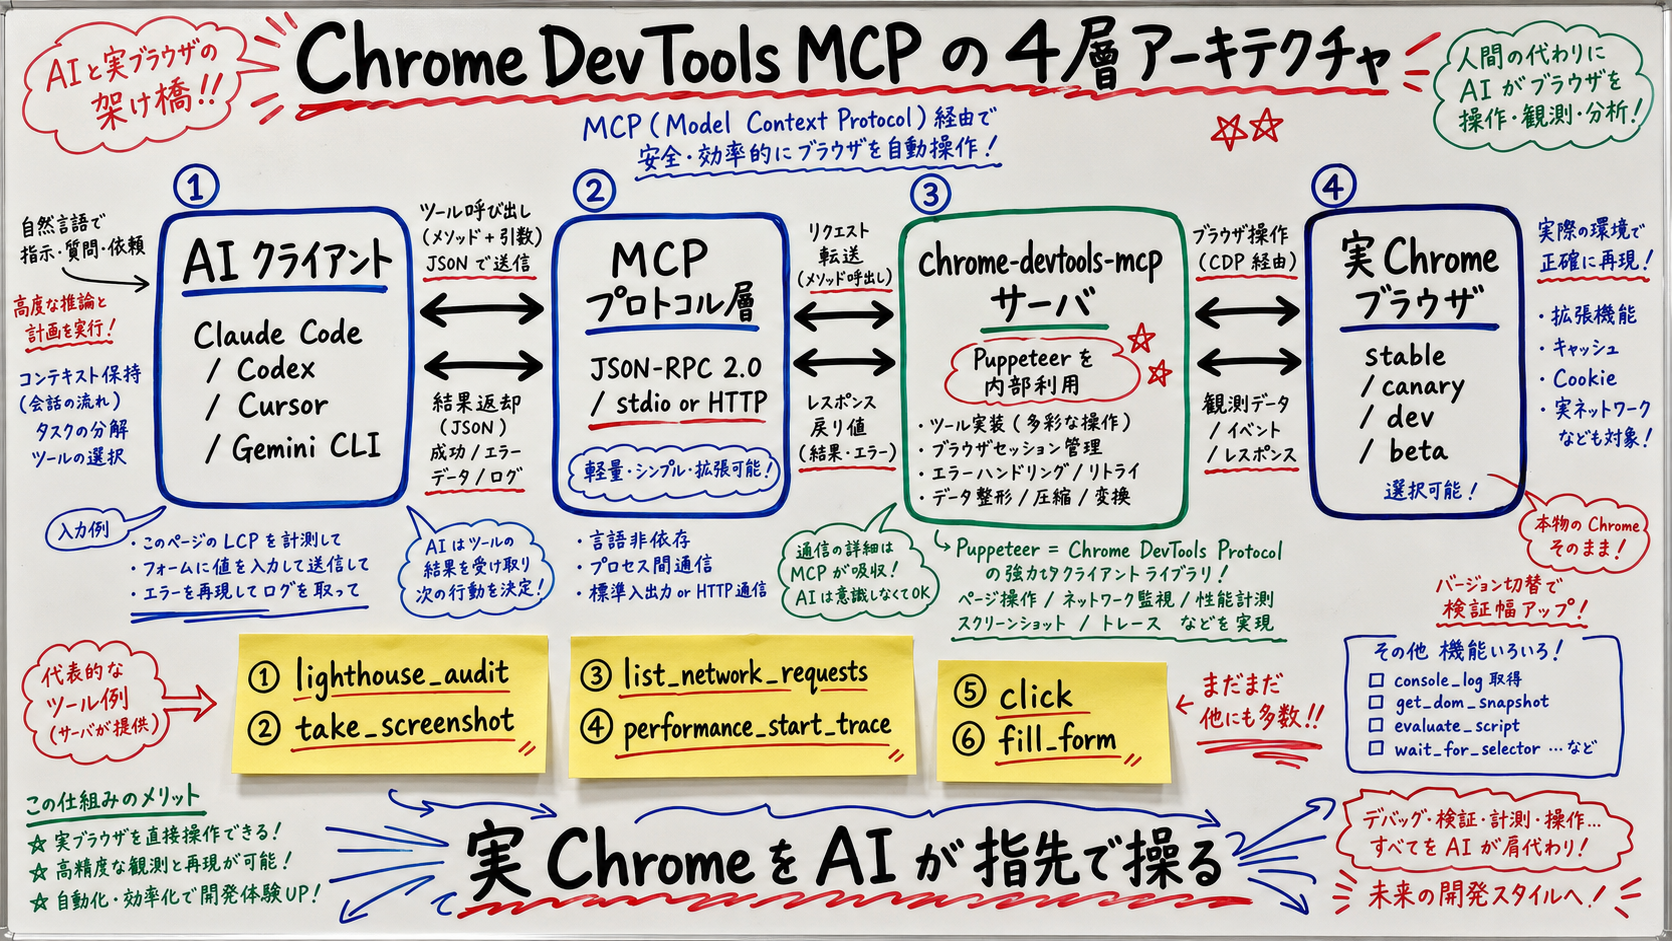
Crucially, Chrome DevTools MCP does not invent its own protocol. It conforms to the Anthropic-led Model Context Protocol (MCP), the same interface that Claude Code, Cursor, Codex, Gemini CLI, and Cline already speak. In the Host / Client / Server three-tier model this is the Server tier.
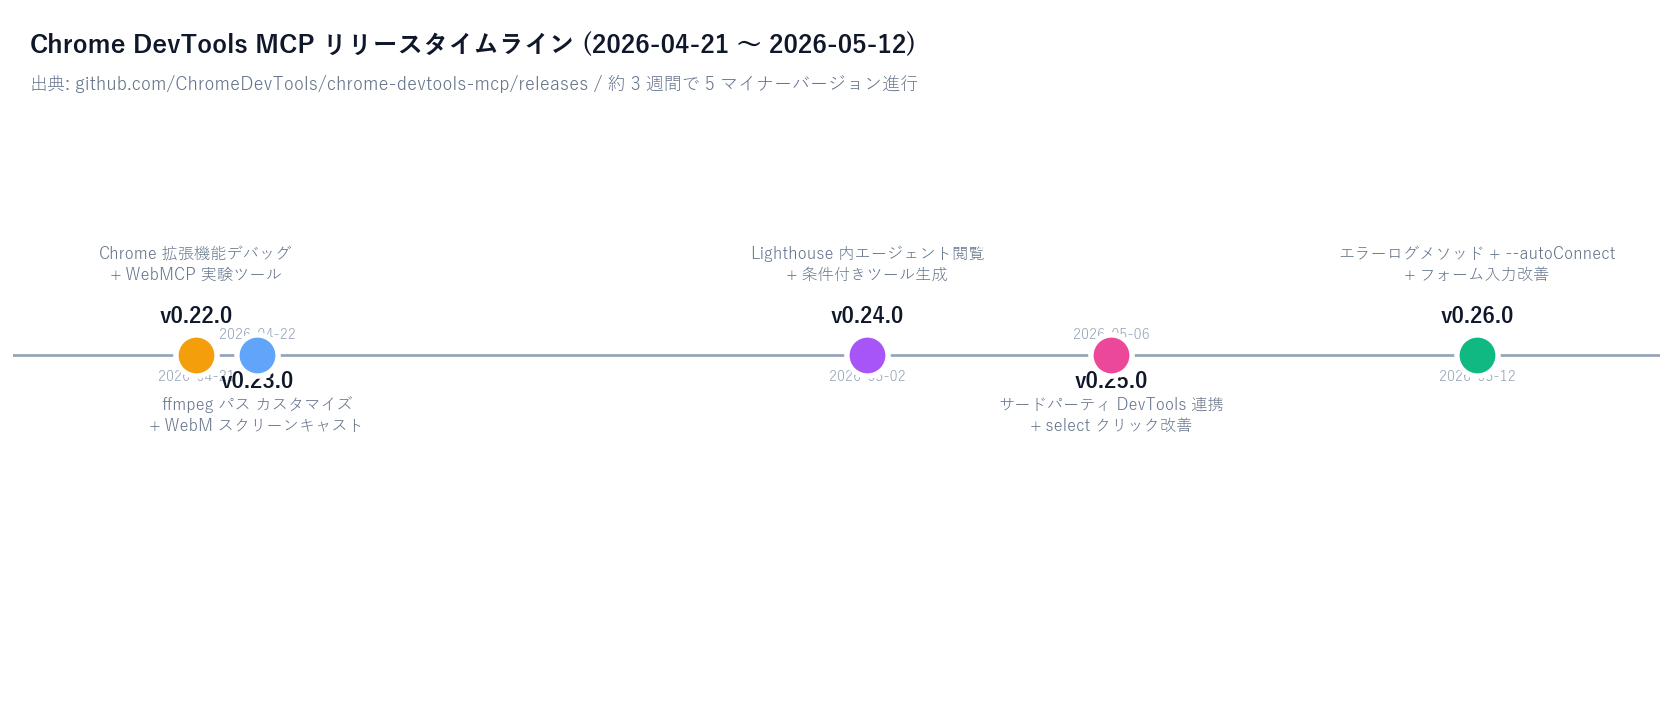
chrome-devtools-mcp ships at near-weekly cadence. Pulling the diff for the last five releases from GitHub Releases as a primary source:
| Version | Released | Key changes (excerpt from official release notes) |
|---|---|---|
| v0.26.0 | 2026-05-12 | New error-log methods / CLI --autoConnect / form-fill improvements |
| v0.25.0 | 2026-05-06 | Third-party DevTools integration / better native select clicking |
| v0.24.0 | 2026-05-02 | In-Lighthouse agent browsing / conditional tool generation |
| v0.23.0 | 2026-04-22 | Customizable ffmpeg path / WebM screencast format |
| v0.22.0 | 2026-04-21 | Chrome extension debugging support / WebMCP experimental tools |
Two of these are particularly hard to overlook: v0.24.0's "in-Lighthouse agent browsing" and v0.26.0's --autoConnect. The former lets the AI read the Lighthouse audit results page directly through tools. The latter lets you toggle "attach to an existing Chrome instance" mode with a single CLI flag. In effect, "lend my already-authenticated Chrome to the AI" is now a one-line configuration.
Chrome DevTools MCP uses Puppeteer (Google's official headless Chrome library) under the hood, launching a real Chrome process (stable / canary / dev / beta) on the host OS and driving it. The AI agent makes MCP tool calls; the MCP server handles browser launch, teardown, page management, DOM snapshotting, and so on.
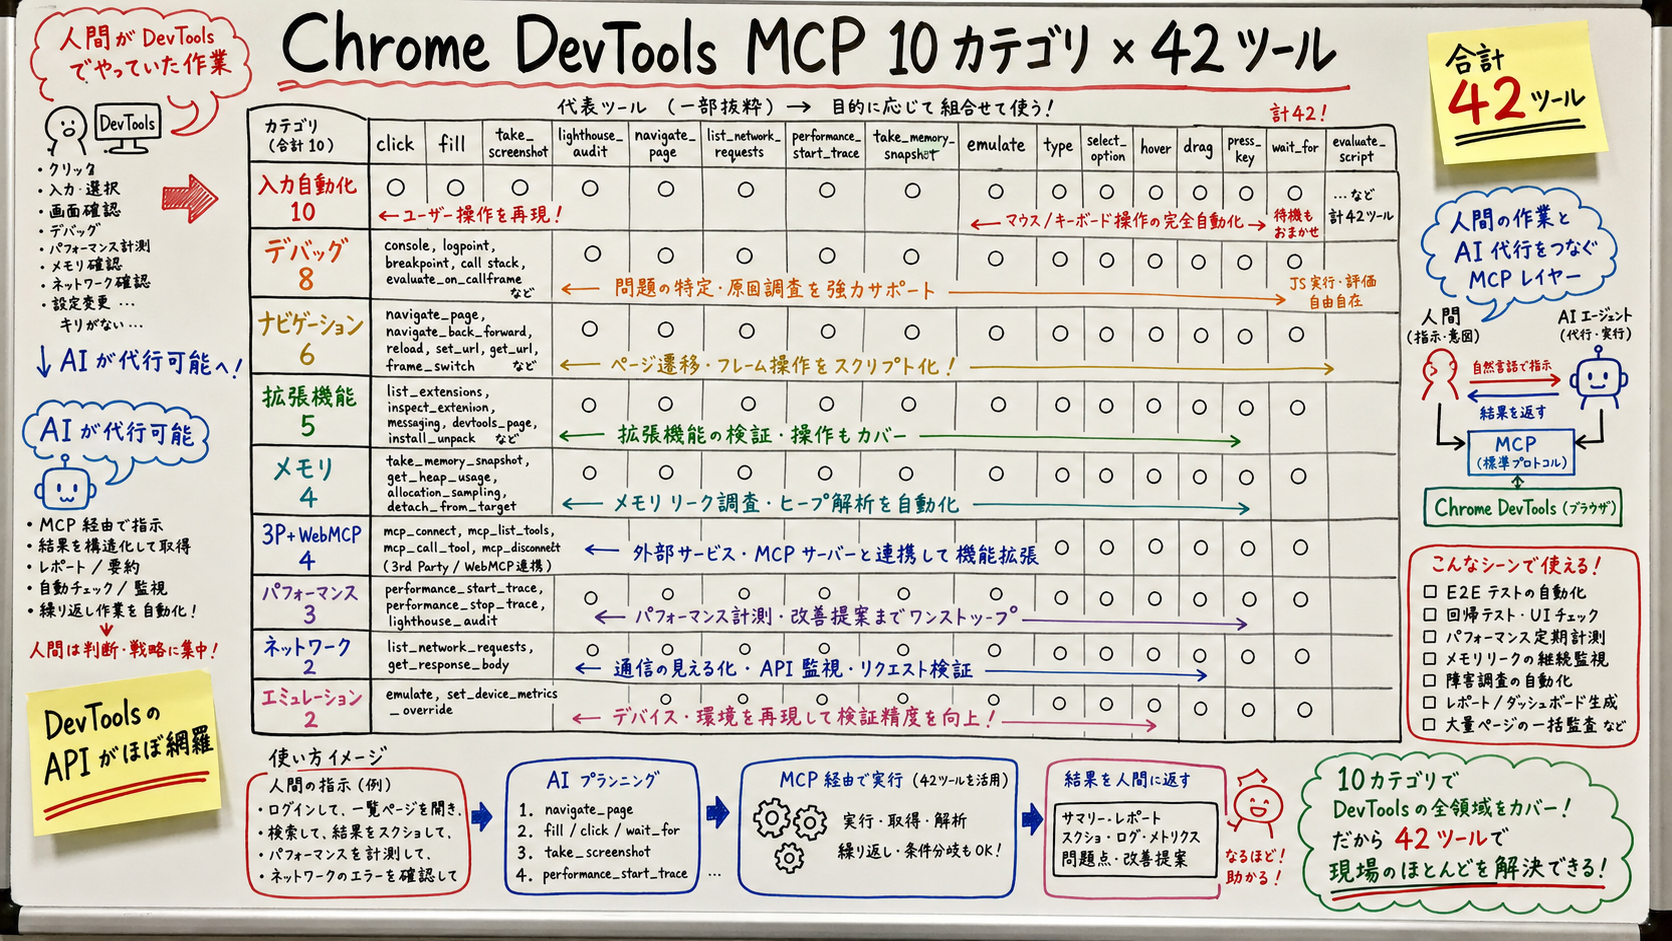
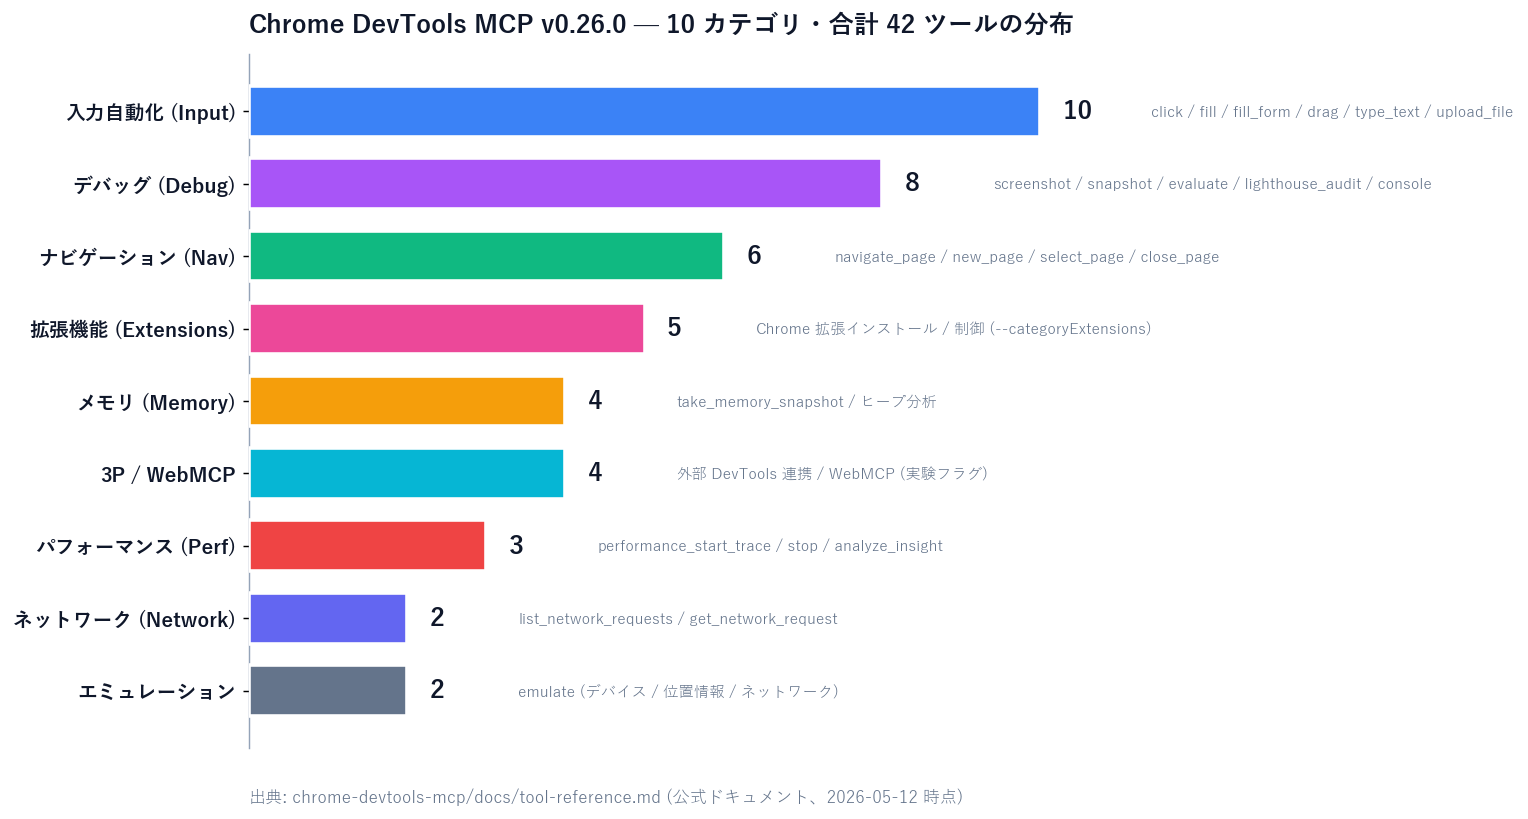
Categories and representative tool names (summarized from the official docs/tool-reference.md):
| Category | Tools | Representative tools |
|---|---|---|
| Input automation | 10 | click / fill / fill_form / drag / type_text / upload_file |
| Navigation | 6 | navigate_page / new_page / select_page / close_page / list_pages |
| Debug | 8 | take_screenshot / take_snapshot / evaluate_script / lighthouse_audit / list_console_messages |
| Performance | 3 | performance_start_trace / performance_stop_trace / performance_analyze_insight |
| Network | 2 | list_network_requests / get_network_request |
| Memory | 4 | take_memory_snapshot and other heap analysis tools |
| Extensions | 5 | Install / control Chrome extensions (requires --categoryExtensions) |
| Emulation | 2 | emulate (device / geolocation / network throttling) |
| Third-party / WebMCP | 4 | External DevTools integration / WebMCP experimental (flags required) |
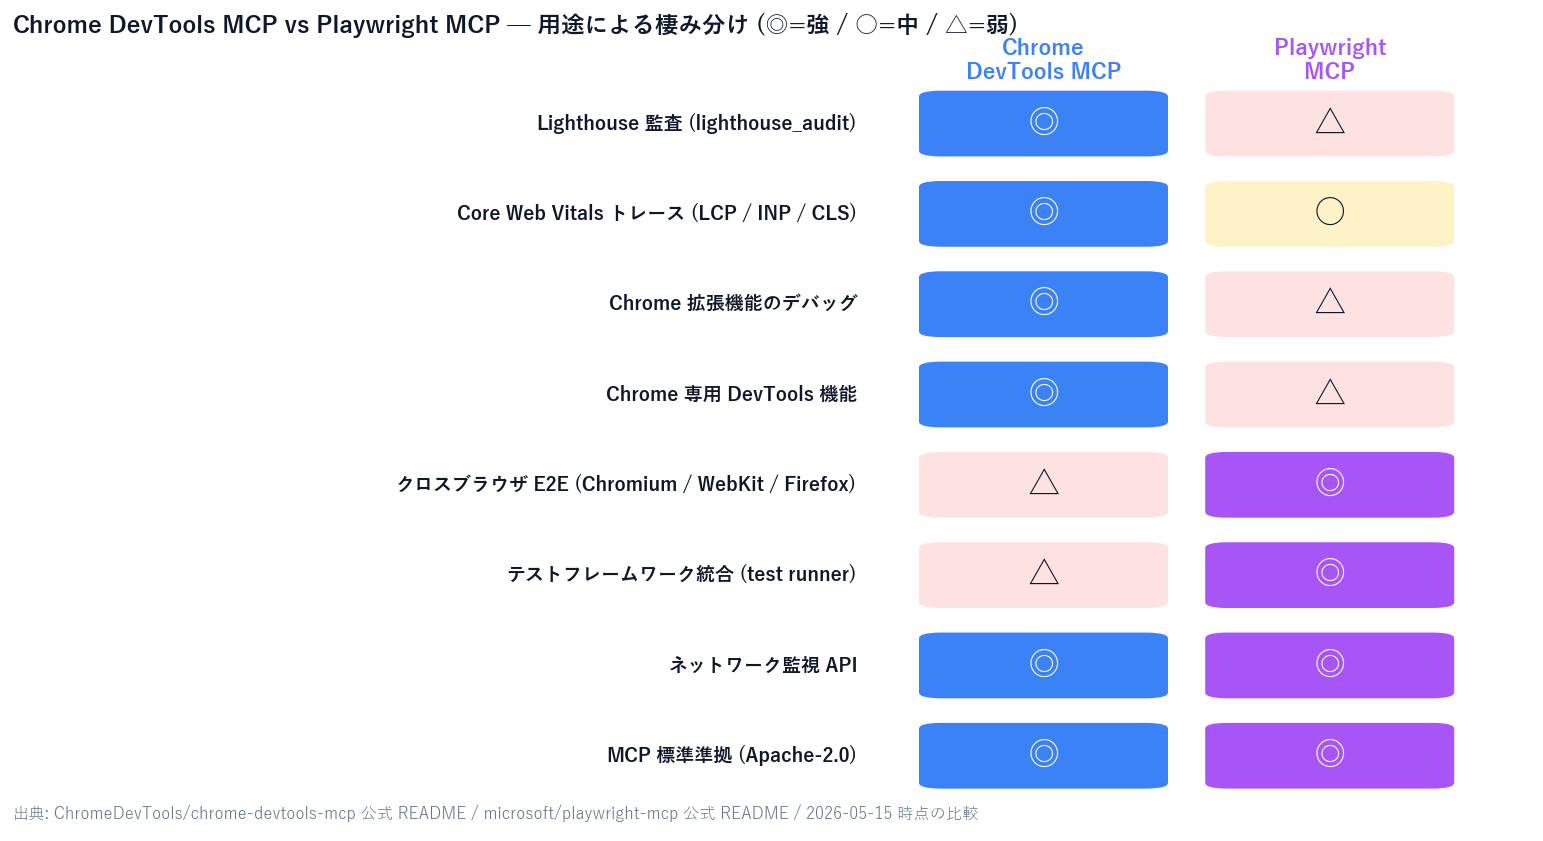
| 項目 | Chrome DevTools MCP | Playwright MCP |
|---|---|---|
| Lead vendor | Google Chrome / DevTools Team | Microsoft / Playwright Team |
| Browser support | Chrome (stable / canary / dev / beta) | Chromium / WebKit / Firefox |
| Lighthouse / Core Web Vitals | Dedicated tools (lighthouse_audit / performance_start_trace) | No direct API — manual implementation |
| Chrome extension debugging | Supported (v0.22.0+) | Not supported |
| Cross-browser E2E testing | Not the intent | Where it shines |
| License | Apache-2.0 | Apache-2.0 |
Prerequisites: Node.js v20.19 or newer (current LTS) and Chrome stable or newer. The package is on npm; each client's MCP config takes a JSON entry like the one below.
Claude Code uses claude mcp add (see Claude Code Docs — Connect Claude Code to tools via MCP).
# Register Chrome DevTools MCP with Claude Code
claude mcp add chrome-devtools npx -- -y chrome-devtools-mcp@latest

# Attach to an existing Chrome (--autoConnect, since v0.26.0)
claude mcp add chrome-devtools npx -- -y chrome-devtools-mcp@latest --autoConnect

# Confirm it's running
claude mcp list
Codex CLI reads ~/.codex/config.toml. Add an entry under [mcp_servers].
# ~/.codex/config.toml
[mcp_servers.chrome-devtools]
command = "npx"
args = ["-y", "chrome-devtools-mcp@latest"]Cursor, VS Code Copilot, and Cline all use the MCP servers configuration UI (or the equivalent ~/.cursor/mcp.json). Paste the same JSON:
{
  "mcpServers": {
    "chrome-devtools": {
      "command": "npx",
      "args": ["-y", "chrome-devtools-mcp@latest"]
    }
  }
}
Gemini CLI uses ~/.gemini/settings.json, with the same structure under mcpServers (see Gemini CLI Docs — MCP servers with Gemini CLI).
{
  "mcpServers": {
    "chrome-devtools": {
      "command": "npx",
      "args": ["-y", "chrome-devtools-mcp@latest", "--channel", "canary"]
    }
  }
}
Tell Claude Code "run a Lighthouse audit on https://example.com and propose three improvements for any metric below 70" — the AI calls lighthouse_audit, reads the scores, and goes into your code to suggest fixes.
Four-step loop: performance_start_trace → page interaction → performance_stop_trace → performance_analyze_insight. Get a performance trace including LCP, INP, and CLS — analyzed by the AI. This is a flagship example in the Chrome for Developers Blog; you plug AI directly into the frontend optimization cycle.
fill_form or fill populates multiple fields at once; take_screenshotcaptures the pre-send state as an image. For AI sales automation, this is exactly the audit-log shape you want — "what did we put in the form, exactly?" — with image-level fidelity.
With list_network_requests and get_network_request, the AI can examine API calls, status codes, and payloads from a page transition. "Why is the Stripe checkout session returning 400?" becomes a task the AI does the same way a human would in the DevTools Network panel.
take_memory_snapshotcaptures a heap snapshot; the AI analyzes which Detached Nodes are growing. SPA memory-leak investigation used to be heavy DevTools work — that's another job the AI can take on now.
Enable the v0.22.0 feature set with --categoryExtensions. Install your own Chrome extension, fetch console messages, debug background scripts — all via the AI. Extension developer productivity goes up sharply.
The official README is explicit: some authentication services block WebDriver-controlled browsers. The official workaround is "attach to an existing Chrome instance." v0.26.0's --autoConnect means you can keep your normal Chrome running and let the AI navigate_page to a cookie-authenticated page directly.
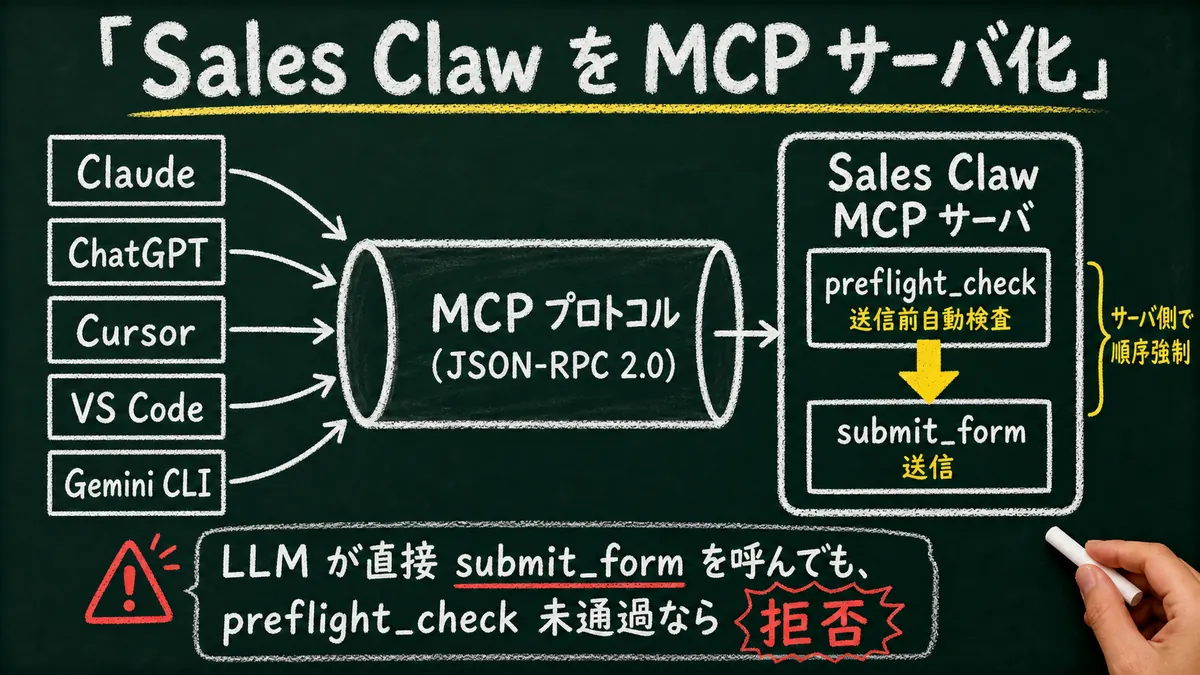
Sales Claw is an OSS tool that lowers misfire and policy-violation risk through policy control, pre-send checks, do-not-contact detection, CAPTCHA-on-detect stop, rate limits, and audit logs. Adding Chrome DevTools MCP gives the pipeline a check layer that is closer to "what a human staring at real Chrome would see."
An example three-layer defense:
take_screenshot, pull JS errors via list_console_messages, log the submit API status from list_network_requests into the audit log.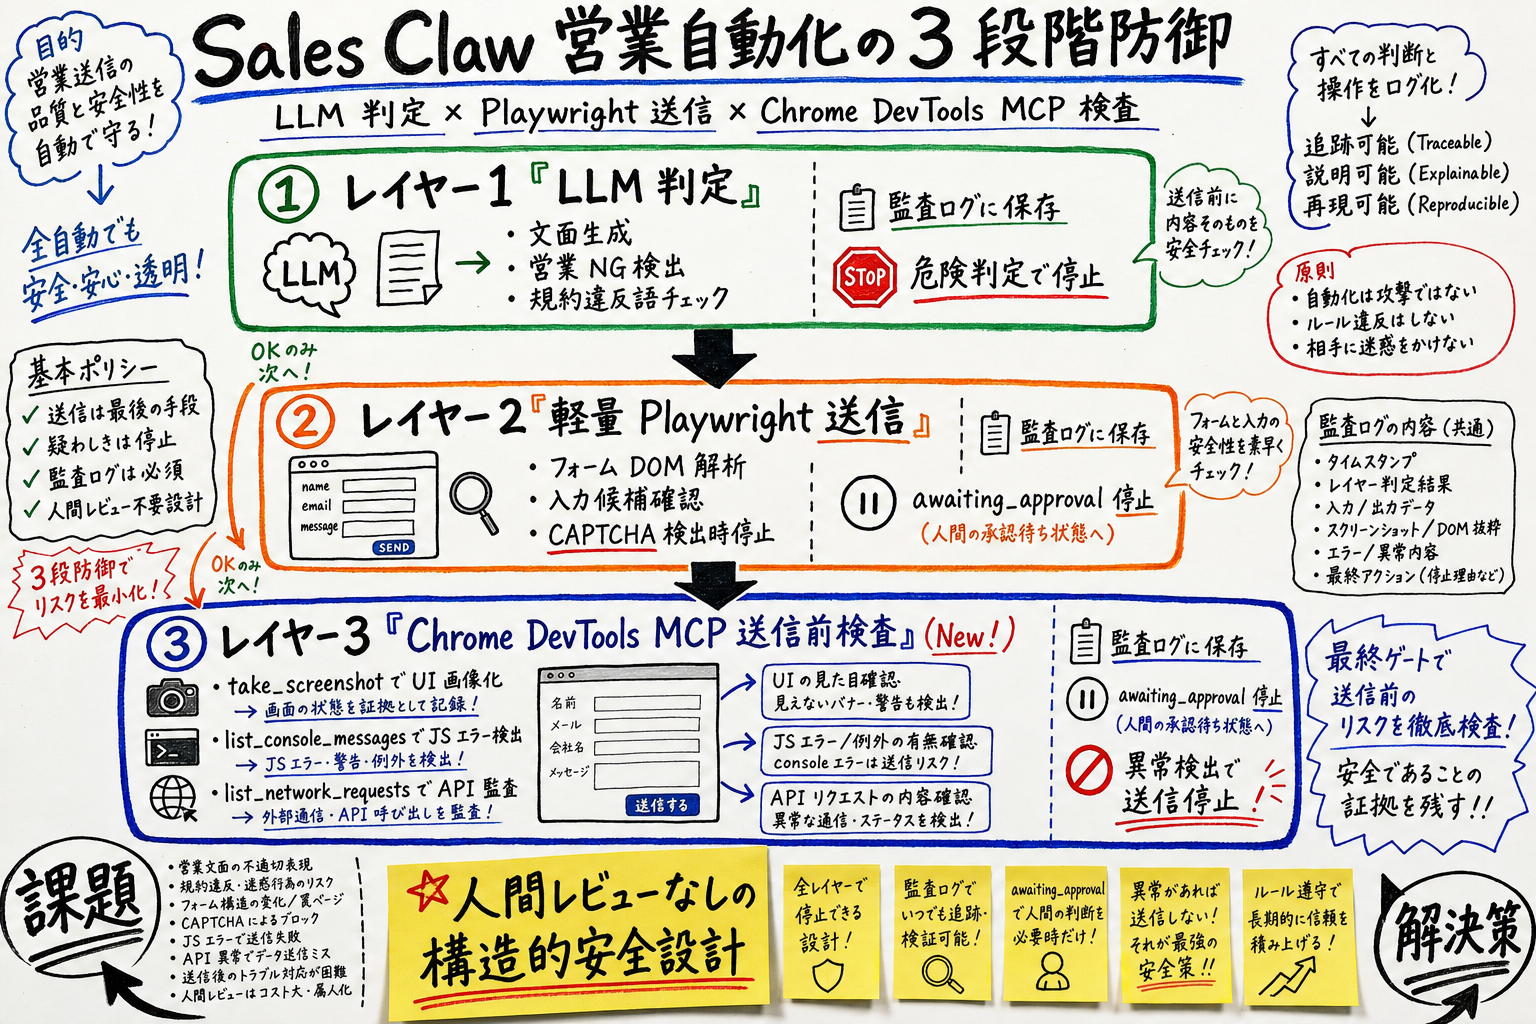
# Example: Claude Code → Sales Claw with Chrome DevTools MCP
> Fill this form with [generated copy]. Before pressing submit,
  run take_screenshot and list_console_messages. If there are
  any JS errors, stop the submission and queue it as awaiting_approval.
With this layer you can catch the kind of anomaly Playwright alone misses — "unknown tracking parameters were injected into hidden form fields," "the submit button doesn't render under this UA," or "the UI shows success while the API returned 500" — and write the evidence to the audit log. That's the Sales Claw-flavored additional line of defense for policy-controlled autonomous operation.
Using Chrome DevTools MCP in policy-controlled autonomous operation means actively lowering each risk through automated checks and design. We don't claim "safe" — we structurally lower risk.
--isolated. If you must use --autoConnecton a production machine, create a dedicated "Sales Claw" Google account and share only that Chrome.--permission-mode ask or acceptEdits on the Claude Code side. Forbid --dangerously-skip-permissions in production.fill / click-class tools have side effects. Design a confirm step that always wraps them.take_memory_snapshot as a watchdog.chrome-devtools-mcp@0.26.0). Read the CHANGELOG weekly, validate before bumping.fill_form to populate the wrong elements.Before putting Chrome DevTools MCP into production
Chrome DevTools MCP is Google's frontal answer to the long-running AI-coding gap of "can't see inside the browser." The path from v0.22.0 (extension debugging) to v0.24.0 (in-Lighthouse agent browsing) to v0.25.0 (third-party DevTools integration) to v0.26.0 (autoConnect) raised the AI-browser-automation baseline in just a month.
For sales automation systems like Sales Claw, this means a second defense layer for pre-send inspection becomes standardizable via MCP. LLM judgment → Playwright submit → Chrome DevTools MCP real-Chrome inspection — every layer reachable from every AI client through one MCP surface.
Next action: install chrome-devtools-mcp@latest locally with --isolated, and run lighthouse_audit on a site you care about. The first tool call covers most of what this article describes. For Sales Claw integration, also read the Quick start and MCP complete guide.
本記事は X 公式アカウントと公式ドキュメントを一次情報として参照しています。
この記事の著者
中澤 圭志
Sales Claw maintainer
Designs and develops Sales Claw. Writes from the field on B2B sales automation and applied AI.